The Bottom Line
Over the past month, I realized a cumulative $6,349.51 profit across MRVL, SPCX, BMNR, and SNDK. Six of eight completed trade cycles were profitable, for a 75% win rate.
On the surface, that looks like a good result.
But after reconstructing 50 fills into 19 distinct sell decisions, I reached a less comfortable conclusion:
The main problem was not stock selection. It was the exit system and position structure. Selling too early was the symptom; unstable position sizing was the cause.
Most directional calls were correct, but I lacked a stable way to maintain exposure. Positions often swung between oversized and too small; an initial reduction easily became a full exit, followed by a quick repurchase at a higher price.
The problem was not whether I could predict a few local highs. The system lacked a stable middle state: a position that was neither fully loaded nor reduced to zero at the first sign of volatility.
How I Calculated This Review
The review covers July 14 through August 21, 2026, and account details have been anonymized. Realized profit and loss follows the FIFO basis used in the IBKR Flex T+1 statement. Sales are grouped by trading decision rather than counting multiple fills from the same order as separate exits.
| Metric | Result |
|---|---|
| Completed trade cycles | 8 |
| Profitable cycles | 6 |
| Cycle win rate | 75.0% |
| Net realized P&L from eight completed cycles | +$6,100.11 |
| BMNR realized P&L within the still-open cycle | +$249.40 |
| Total realized P&L for the four stocks | +$6,349.51 |
| BMNR unrealized P&L as of August 21 | +$1,946.18 |
| Average profit-capture rate in profitable cycles | 60.1% |
| Account equity | $46,732 → $57,831 |
The results fully include both losing cycles: MRVL lost $355.07 after I repurchased near the day’s high and later closed the position, while SNDK lost $235.47 on a stop at $1,195, for a combined −$590.54.
Account NAV increased by $11,099, but that figure covers the entire account. The disclosed realized P&L from the four stocks plus BMNR’s period-end unrealized gain totaled $8,295.69. The remaining $2,803.31 reflects account-level P&L or valuation changes that were not allocated to these four names, so it is excluded from this review’s trade-level conclusions.
Here, “cycle profit-capture rate” means final realized profit divided by the maximum mark-to-market profit reached during that cycle. It better reflects the account experience than simply measuring how far a stock rose after a sale, because gains already realized through scaling out remain part of the calculation.
Capture rate cannot evaluate a trade by itself. A small position can achieve an excellent rate while contributing little profit to the account; a large position can be directionally correct yet force an early exit because normal volatility exceeds the account’s tolerance.
The sample is also limited: 19 sell decisions were concentrated in four stocks and nearby dates, and many 10- and 20-day post-sale windows were not yet complete. A stock continuing higher after a sale is a signal worth reviewing, not automatic proof that the sale was wrong.
Four Stocks, Four Different Failure Modes
SPCX: An Oversized Position Turned Normal Volatility into an Account-Level Event
On August 3, I bought 200 shares of SPCX at an average price of $110.88. The next day, I sold 80 shares at $116.50 during regular trading and the remaining 120 shares at $114.65 after hours. The cycle produced a $900.69 profit.
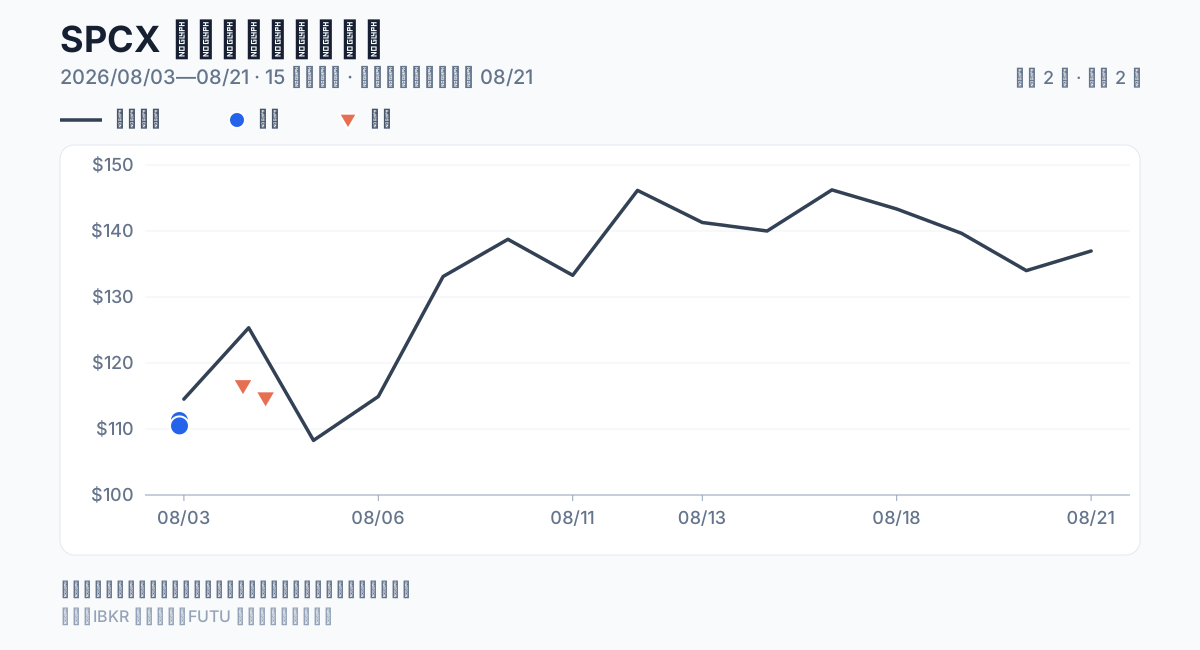
After the sale, SPCX peaked at $149.80 over the next 13 observable trading days. If we simply assume that the position was held from the time it was first opened until August 21st, the paper profit would have been $5,218.50, which is $4,317.81 more than the actual position.
But the $4,317.81 is not “money that was meant to be earned.” The rearview high point cannot be execution, nor can it mean that it should be held at that time.
The real issue is that SPCX reached 45.1% of NAV at peak position value. At this level of concentration, a 5% stock price move would cause the account to move about 2.3%. As for whether this directly triggers selling, execution data cannot prove it; but this position size structure will indeed amplify the ordinary fluctuations of the underlying into account-level pressure.
Losing 40% intraday is not outrageous in itself. The problem is that the remaining 60% is not defined as the trend core position, but returns to zero all together after the market is less liquid.
The lesson SPCX taught me is not “Don’t take profits in the future”, but don’t build a position size that you can’t hold first.
MRVL: The Exit Price Was Fine; the Problem Was Jumping Between Fully Invested and Flat
MRVL best explains why review cannot be the only selling point.
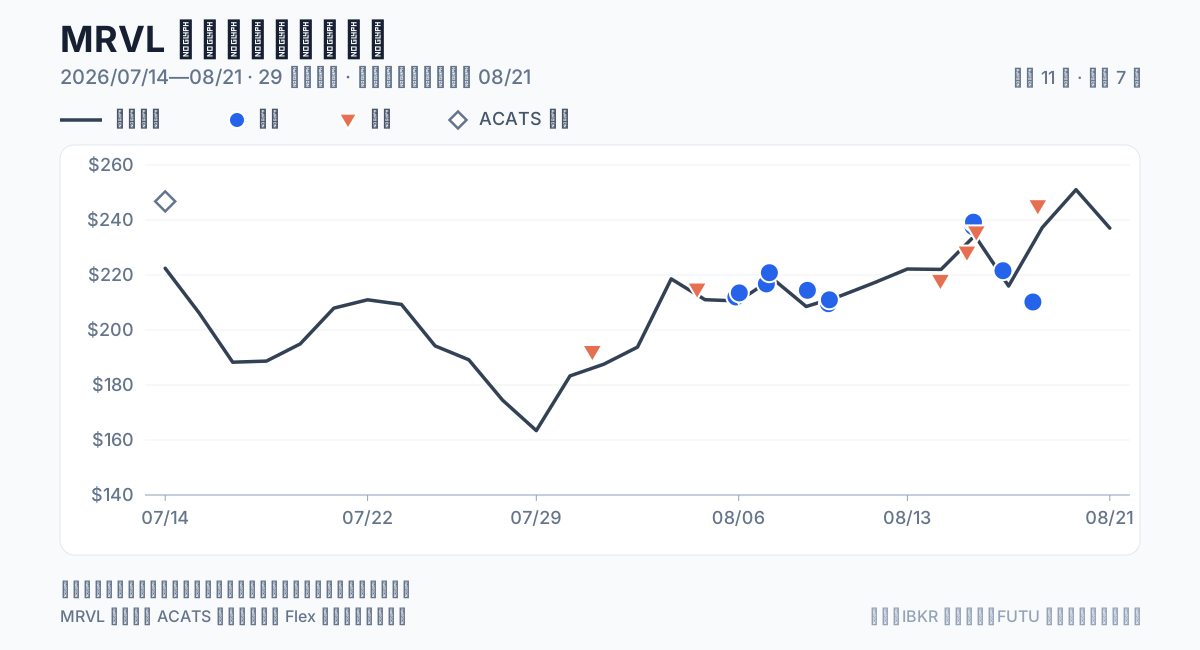
On August 11, I once held 100 shares at an average price of $215.81, accounting for approximately 41.5% of the account equity. The subsequent position size path is:
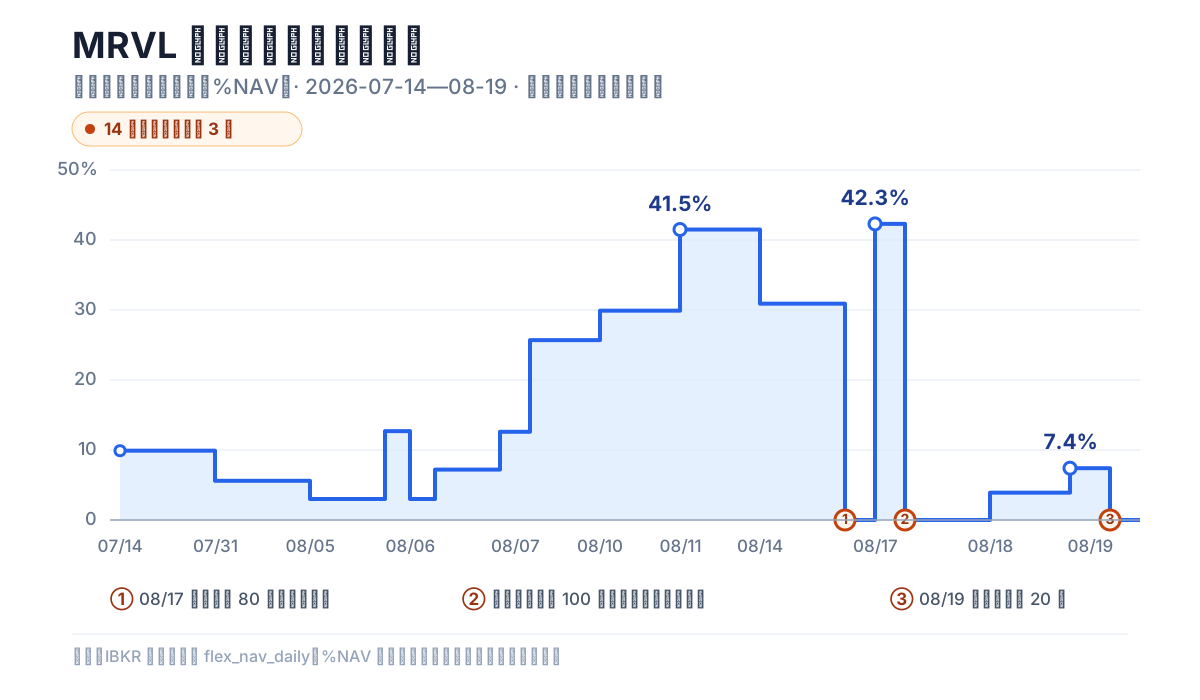
In 14 trading days, MRVL holding reset to zero three times.
The final 20-share trade was executed well: the average price was $215.92 to buy and $245 to sell, achieving +$581.07 and a cycle profit capture rate of 93.8%. So the selling price of $245 is not a major error.
The real problem is that when the main uptrend arrives, there are only 20 shares of position size. If the same entry and exit were mechanically scaled to 100 shares, the profit is approximately $2,907, and the difference is approximately $2,326. This number is only used to illustrate the impact of position size exposure. It does not mean that 100 shares should be held at that time - that will return to the concentration risk of a single stock exceeding 40% of NAV.
At that time, earnings report was approaching, and it was a reasonable choice to reduce the risk of the event. The problem is that I did not calculate “how much to keep before earnings report” based on the bearable gap loss, but switched on the spot between 41.5% → 0% → 42.3% → 0% → 7.4%.
The lesson of MRVL is: Stable holding does not mean heavy positioning; selling well cannot make up for lack of preparation position size.
BMNR: I Sold the Low-Cost Position, Then Bought Back More at a Higher Price
BMNR’s cycle is not over as of August 21, so we can’t call it a winner now.
What I can confirm is that I sold 300 shares early in the trend at an average price of $16.84 and later bought back 1,000 shares at an average price of $21.57. As for the overlapping 300 shares, the price difference paid by buy back this time is about $1,418.34, which is 5.7 times the previously realized profit of $249.40; holding also expanded from 400 shares to 1,100 shares.
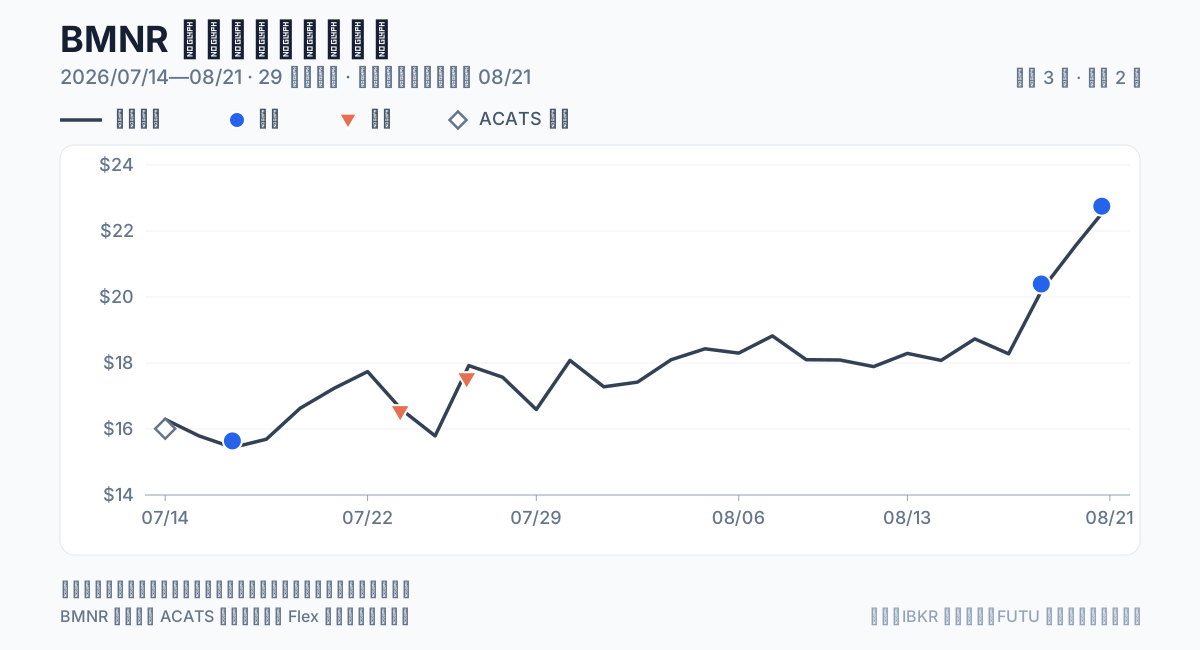
Buying back above the previous sale price is not inherently wrong. A newly confirmed trend may justify re-entry at a higher level. The problem was that after closing the old position, I did not treat the next purchase as a brand-new trade with a freshly calculated risk budget.
Selling a low-cost position and then increasing exposure at a higher price sacrifices the cost advantage while raising account risk. A trend-based add cannot replace the original base position, and a new setup should not restore a large position in one step.
SNDK: A Rally After You Sell Does Not Automatically Mean the Stop Was Wrong
SNDK has realized a cumulative profit of $4,711.11, contributing approximately 74% of the realized profits of the four stocks, and is also the most profitable stock in this group of trades. Regarding the fundamentals logic and Investor Day execution of this round of market conditions, I wrote separately in my previous article “Do Not Try to Sell at the Exact Top—A Complete Review of One SNDK Trade”.
It also sells early. For example, an 8-share cycle was only held for two days, and in the end only about 26.5% of the cycle peak profit was obtained; another time, after 5 shares of $1,195 stop-loss, it started to rebuild at a higher position within a few hours. The latter main rising cycle eventually expanded to 20 shares, with an average price of $1,341.03, and the peak position size reached 53.4% NAV.
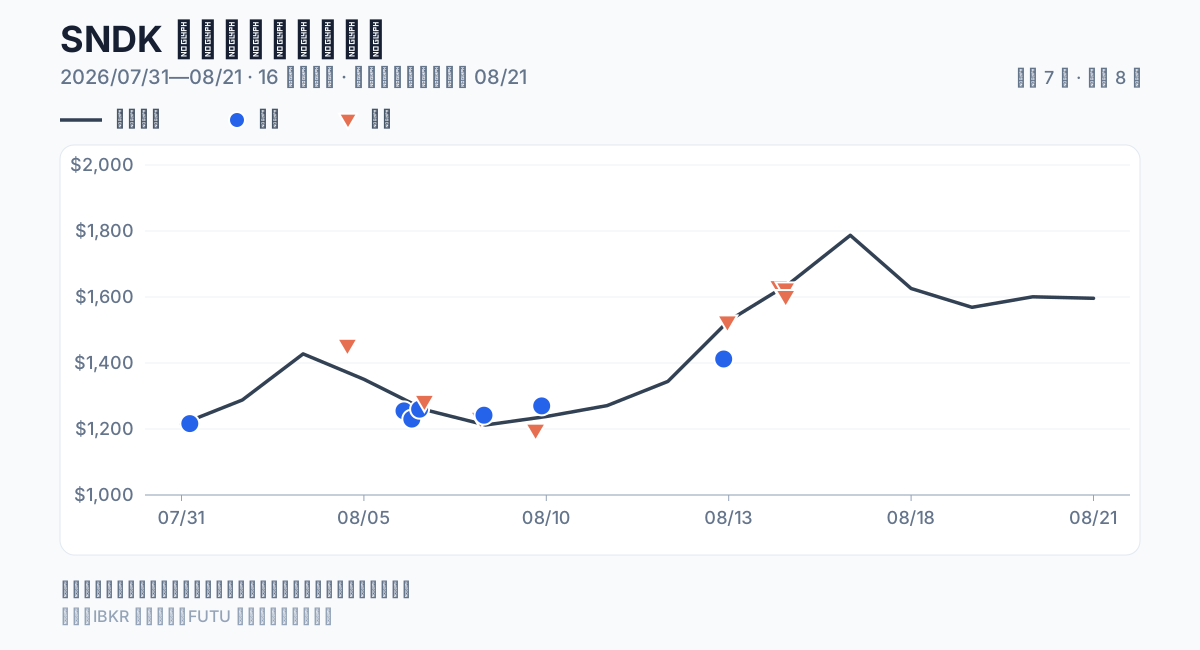
But this does not mean that all selling is a mistake.
On August 5, I sold 1 share of SNDK for $1,452.01, and the profit capture rate for this cycle reached 90.7%; 5 trading days after the sale, the stock price was 4.3% lower than the selling price. It later hit a new high, which cannot in turn prove that the quality of take profits is poor this time.
Another stop-loss of $1,195 can also be established: there is almost no unrealized profit in this cycle, and the selling price is close to the low of the day. There is no problem in controlling the risk first. What really needs improvement is that stop-loss restored position size at a higher price a few hours later, without a clear new setup and binning rebuild process.
The correct stop-loss may miss the subsequent rise. review should evaluate “the quality of the decision at the time” and “the price result after the sale” respectively.
Three Failure Chains That Actually Mattered
Looking at the four stocks together, the problem can be summarized into three independent links:
| failure chain | Specific performance | Representative cases |
|---|---|---|
| Concentration is too high | Normal fluctuations in the underlying are amplified into fluctuations in large accounts | SPCX peak 45.1%, SNDK peak 53.4% NAV |
| position size is unstable | Rapidly jumps between heavy and short positions | MRVL returns to zero 3 times in 14 trading days |
| Exits mixed with rebuilds | stop-loss or take profits soon followed by recovery at higher prices to a larger position size | MRVL, BMNR, SNDK |
There is also an obvious amplifier: unconventional trading hours. Eight of the 19 sales occurred overnight, pre-market or after-market. However, the sample is too small and the trades are highly clustered, so it cannot be said based on this that “selling before the market is definitely worse”.
What is certain is that during periods of weak liquidity, it is easier to amplify execution deviations, and it is also easier for a trim the position to continue to evolve into exit the position entirely. The last 120 shares of SPCX were sold after the market opened, and a full position exit of MRVL occurred before the market opened. These are both scenarios worthy of increasing the operating threshold.
The Trading Rules I Rewrote
This batch of data only has 8 closed cycles, which is not enough to prove that a certain set of precise parameters is optimal. What follows is not a “one-size-fits-all recipe,” but rather a set of trial-run rules that address high-confidence problems first.
1. Replace fixed planned position size with “current risk tolerance”
I no longer maintain a manually updated “target position size,” nor do I impose a default cap such as 20%. In a small account holding only a few high-conviction names, a fixed ratio can reduce capital efficiency, while yesterday’s target can quickly become obsolete as market conditions, entry prices, and event risks change.
Before each purchase, add to the position or trim the position, only re-confirm three things:
- Where is the current invalid price and how much will be lost per share after triggering;
- What is the reasonable gap hypothesis under earnings report or major events;
- What is the maximum amount the account is willing to lose when the judgment is wrong this time.
These three inputs produce the maximum position currently allowed, not a target that must be filled. Being below the limit means only that risk capacity remains; it does not mean the current price justifies adding.
2. Divide trend positions into “core” and “adjustable” components, with dynamic weights
Only positions defined in advance as trend trades need a core component. The core position is the portion of the current risk budget that can wait for confirmation on the daily chart; the adjustable portion is scaled out at price targets or at +1R / +2R. 1R here is the maximum tolerable loss set before opening a position. For example, 1R is $500, and a profit of +1R is $500.
There is no fixed ratio between the two. The core can be smaller when earnings are near or the stop is far away; it can be larger when the entry is favorable, the invalidation level is close, and there is no event risk. For a purely event-driven or short-term swing trade, the core allocation can be zero. Hard stop-loss and argument invalidation always take priority, and exit cannot be delayed for the sake of “preserving core position”.
The risk upper limit is calculated as follows for ordinary transactions and event transactions respectively:
1
2
3
4
Risk per share = |entry price − invalidation price|
Allowed share count ≤ acceptable loss per trade ÷ risk per share

Event-position market value ≤ acceptable event loss ÷ assumed gap percentage
For example, if you are willing to bear a maximum loss of $1,000 on earnings report, assuming the worst-case gap is 15%, then the upper limit of the market value of event-driven position is approximately $6,667. This is a risk cap and not a buy recommendation; moving stop-loss does not protect the overnight gap.
3. The first reduction should not default to closing the entire position
For the first time in trend trading, take profits will process the adjustable positions first, and the remaining core position will be managed according to daily conditions. Whether to lose more than half at a time is only used as a review reminder and is not set as a hard ban that will prevent reasonable risk control. Hard risks, argument failure, and pre-planned event drawdowns are excluded.
Every time you sell a level, you must write down in advance: how much to sell, why you want to sell it, and under what conditions you will sell the next level. Only in this way can we distinguish between “batches according to plan” and “cannot stop after selling”.
4. Any repurchase after a full exit must be treated as a new setup
If new information appears after a full exit, begin with a small test position that remains manageable even if confirmation fails again. Add only after a breakout, retest, or closing-price confirmation. Recalculate the risk cap on every addition instead of mechanically restoring the previous share count.
The new entry can be higher than the old exit; the old sale price is not the anchor. The new risk-reward ratio and invalidation conditions are what matter. But fear of missing out is not a reason to restore the entire position at once.
5. Do not make unplanned full exits during extended hours
By default, pre-market, post-market and overnight processes only process the parts that are allowed to be adjusted in advance; if it is not a hard event, the argument is invalid, or the event has been written into the plan to reduce the position, priority will be given to waiting for liquidity to recover. Use limit orders when execution is absolutely necessary.
This rule is not because 8 samples are enough to prove the quality of the period, but because the liquidity and price difference of extended-hours session inherently require a higher execution threshold.
6. Record a reason for every sale
The IBKR execution record only tells me “sold” and will not tell me why it was sold. Every time you sell in the future, you must add one of the following five categories:
1
Hard stop / trend exit / swing-profit exit / event-risk reduction / other
Without this field, review can only guess the intention based on the price, and it is easy to use the backward-looking increase to negate the originally correct risk control.
Five Things I Will Watch in the Next Round
Next time review, instead of counting “sell too early how many transactions”, check:
- Whether the upper limit of position size is recalculated based on the latest price, failure point and event risk before each add to the position;
- When the trend logic is not invalid, whether core position is reset to zero unplanned due to continuous trim the position;
- Whether trim the position exceeds 50% or returns to zero within 3 days;
- Whether to restore the big position size at a higher price from T+0 to T+3 after exit the position entirely, but without a new setup and risk budget;
- Whether each sale has a clear
exit_reason.
Wait until at least 20 new closed periods are added, and then evaluate whether these review trigger conditions are valid, instead of looking for a fixed holding ratio that applies to all markets. Until then, it’s more important to plug the most obvious behavioral loopholes than to continue looking for a more magical selling point.
Final Thoughts
The easiest conclusion to draw from this round of trading is: “I always sell too early.”
But this sentence has almost no action value. No one can stably sell at the highest point, and continuing to rise after selling does not mean selling is wrong.
What’s really worth bringing into the next round of trading is:
I don’t need a system that guesses the top for me. I need a system that allows me to continue to maintain reasonable exposure when my judgment is correct, and that can lock losses within my budget when my judgment is wrong.
Stock selection determines where the opportunity comes from, and position size determines whether this judgment can be converted into account income. The next step to change is not the ability to predict, but to have clear boundaries for core position, band positions and event risks.
Data Description
- execution details come from IBKR execution records, with a total of 50 executions; this article based on 19 sell decisions for review.
- The realized profit and loss adopts the IBKR Flex T+1 statement FIFO caliber; the BMNR cycle is still open, and the final profit and loss and capture rate cannot yet be determined.
- Quotes as of August 21, 2026. The 10-day and 20-day observation windows for more recent sales have not yet been completed, and the hindsight differences in the article are not realizable profits, nor can they be added to the “total loss.”
- Part of the opening holding of MRVL and BMNR was transferred from ACATS, and the original purchase date is missing; this does not affect the analysis of the position size path and realized profits and losses after the transfer in this article.
- There are no deposits and withdrawals within the account range. The account NAV and the profit and loss of the four targets are not in the same statistical range, and the difference of $2,803.31 is not further attributed in this review; holding and the account information in the article have been desensitized.
trade review is for personal use only and does not constitute investment advice.
-
Previous
SNDK Investor Day 2026 Review: Valuation Re-Rating and Scaling Out -
Next
Micron FY2026 Q3 Earnings: This Is More Than Another Memory Pricing Cycle