The Bottom Line
Micron’s quarter can be summarized by three numbers: $41.5 billion in revenue, an 84.6% GAAP gross margin, and $28.2 billion in GAAP net income.
But the more important point is not the extraordinary level of profit; it is that the mechanism producing that profit is changing:
- Growth was driven mainly by higher DRAM and NAND pricing, not simply by higher shipment volume;
- Data-center-related businesses contributed about 61% of company revenue. AI demand is no longer only an HBM story;
- Through multi-year Strategic Customer Agreements (SCAs), Micron is exchanging part of its upside pricing exposure for volume commitments, price floors, and customer financing;
- Tight supply and long-term contracts may reduce the volatility of the traditional memory cycle, but they do not prove that cyclicality has disappeared.
My judgment is:
This is more than another rise in memory prices. Micron is using today’s supply shortage to convert short-term pricing power into long-term contracts. If the SCAs perform as intended, investors may eventually focus less on when earnings will peak and more on how long elevated earnings can persist.
An approximately 85% gross margin is still an extreme level. Long-term contracts may raise the earnings floor, but current margins should not be extrapolated indefinitely.
1. How Strong Were the Results?
Micron’s key results for the quarter ended May 28, 2026 were:
| Metric | FY2026 Q3 | Quarter over quarter | Year over year |
|---|---|---|---|
| Revenue | $41.456 billion | +74% | +346% |
| GAAP gross margin | 84.6% | +10.2pct | +46.9pct |
| GAAP operating income | $33.318 billion | +106% | +1,436% |
| GAAP net income | $28.243 billion | +105% | +1,398% |
| Non-GAAP EPS | $25.11 | +106% | +1,215% |
| Operating cash flow | $25.388 billion | +113% | +451% |
| Adjusted free cash flow | $18.304 billion | +165% | +839% |
Several profit margins are more intuitive:
| Indicators | FY2026 Q3 |
|---|---|
| GAAP gross margin | 84.6% |
| GAAP operating margin | 80.4% |
| GAAP Net Profit Margin | 68.1% |
| Operating cash-flow margin | 61.2% |
| Adjusted free-cash-flow margin | 44.2% |
As a rough horizontal coordinate around the same period, Micron’s GAAP for FY2026 Q3 is about 80.4%; SK Hynix’s GAAP for Q2 2026 is about 76.3%, and Samsung’s Device Solutions (DS) unit is about 70.0%. However, the quarterly deadlines, accounting standards and product portfolios of the three are different. Samsung DS also includes non-storage businesses. Therefore, this set of figures can only illustrate the magnitude of this round of industry prosperity, and cannot directly judge competitive advantages or share rankings based on them.
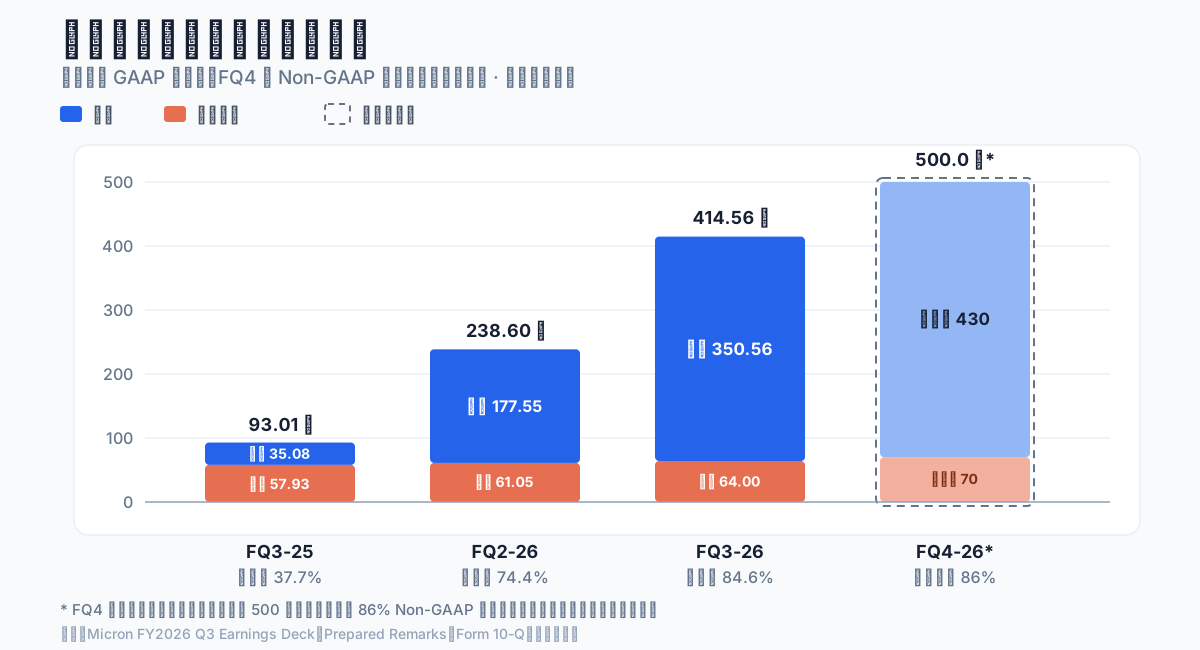
This was not an ordinary earnings improvement; revenue growth, pricing, and operating leverage all expanded at once.
Although R&D and administrative expenses increased year-on-year, they were much slower than revenue: R&D expenses in this quarter were US$1.316 billion, a year-on-year increase of 36%; selling and administrative expenses were US$407 million, a year-on-year increase of 28%. There are also US$15 million in net other operating expenses, so gross profit cannot be directly restored to operating profit by just subtracting R&D and sales and management expenses. After a significant increase in revenue, most of the new gross profit still falls into operating profit.
On a year-on-year basis, Micron’s revenue increased by US$32.155 billion, and gross profit increased by approximately US$31.548 billion. According to a rough calculation of the disclosed figures, the increment gross margin reached approximately 98.1%; the cost of sales during the same period only increased from US$5.793 billion to US$6.400 billion, a year-on-year increase of approximately 10.5%. This set of data points the profit explosion this quarter mainly to ASP and product mix, rather than shipment expansion.
The adjustment range of earnings report is also very small: GAAP diluted EPS is $24.67 and Non-GAAP EPS is $25.11, the difference between the two is only about 1.8%. Non-GAAP reconciliation excludes $341 million in stock-based compensation, accounting for approximately 0.8% of revenue; what is mentioned here is the Non-GAAP adjustment basis, which is not equivalent to the entire stock-based compensation basis in the statement of changes in equity. So this unusually strong profit wasn’t driven primarily by Non-GAAP adjustments.
2. Revenue Growth Came Mainly from Pricing, Not Volume
This is the most critical point in understanding earnings report this quarter.
DRAM
- Revenue: $31.328 billion
- Share of total revenue: 76%
- Month-on-month growth: 67%
- bit shipments: low single digit growth
- ASP: a month-on-month increase of about 60% (the company’s original text is low-60s percentage range)
NAND
- Revenue: 9.943 billion
- Share of total revenue: 24%
- Month-on-month growth: 99%
- bit shipments: mid-single digit growth
- ASP: up approximately 85% month-on-month (the company’s original text is mid-80s percentage range)
The combined revenue of DRAM and NAND was US$41.271 billion, a difference of US$185 million from the company’s total revenue; the difference was revenue from other products, mainly NOR. 76% and 24% are the disclosed proportions after rounding and do not mean that the two types of products exactly constitute the entire revenue.
In other words, DRAM and NAND revenue grew 67% and 99% sequentially respectively, but shipments only increased by a few percentage points, with the vast majority of the increase coming from higher average selling prices. AI demand, industry supply constraints, and HBM’s additional consumption of wafer capacity have jointly tightened traditional DRAM and NAND supply, causing most of the new revenue to be converted into gross profits.
Static ASP Stress Test
In order to quantify price sensitivity, a mechanical static stress test can be done: Assume that bit shipments, product mix and unit costs remain unchanged, the comprehensive selling price of all businesses changes in the same proportion, and the cost of sales is fixed at $6.400 billion in Q3, and the GAAP operating expenses are fixed at $1.738 billion.
| Comprehensive selling price relative to Q3 | Revenue (USD 100 million) | Gross margin | Operating profit (USD 100 million) |
|---|---|---|---|
| Flat (actual) | 414.56 | 84.6% | 333.18 |
| -30% | 290.19 | 77.9% | 208.81 |
| -50% | 207.28 | 69.1% | 125.90 |
| -70% | 124.37 | 48.5% | 42.99 |
| -85% | 62.18 | -2.9% | -19.20 |
In this static model, the comprehensive selling price needs to drop by about 84.6% compared with Q3 before gross margin will drop to zero; if operating expenses are included, the operating profit will drop to zero when the comprehensive selling price drops by about 80.4%. It shows that there is a thick static buffer between current revenue and costs, but this result cannot be regarded as a true cycle bottom, let alone predict that the company can withstand a price drop of more than 80%.
The true price reduction cycle is usually accompanied by product mix changes, insufficient operating rates, rising unit costs, inventory impairments, and increased depreciation after new production capacity is put into operation in FY2027-FY2028. The actual downside scenario may be significantly worse than this table.
3. AI Demand Has Spread from HBM Across the Product Portfolio
Micron’s Cloud Memory Business Unit (CMBU) generated $13.769 billion of revenue, while its Core Data Center Business Unit (CDBU) generated $11.524 billion. Together they contributed $25.293 billion, or about 61% of company revenue.
| Business units | Revenue | Quarter-on-quarter growth | Gross margin | operating margin |
|---|---|---|---|---|
| Cloud Storage CMBU | $13.769 billion | +78% | 83% | 78% |
| Core data center CDBU | $11.524 billion | +103% | 87% | 83% |
| Mobile & Client MCBU | $11.521 billion | +49% | 87% | 86% |
| Automotive & Embedded AEBU | $4.634 billion | +71% | 79% | 75% |
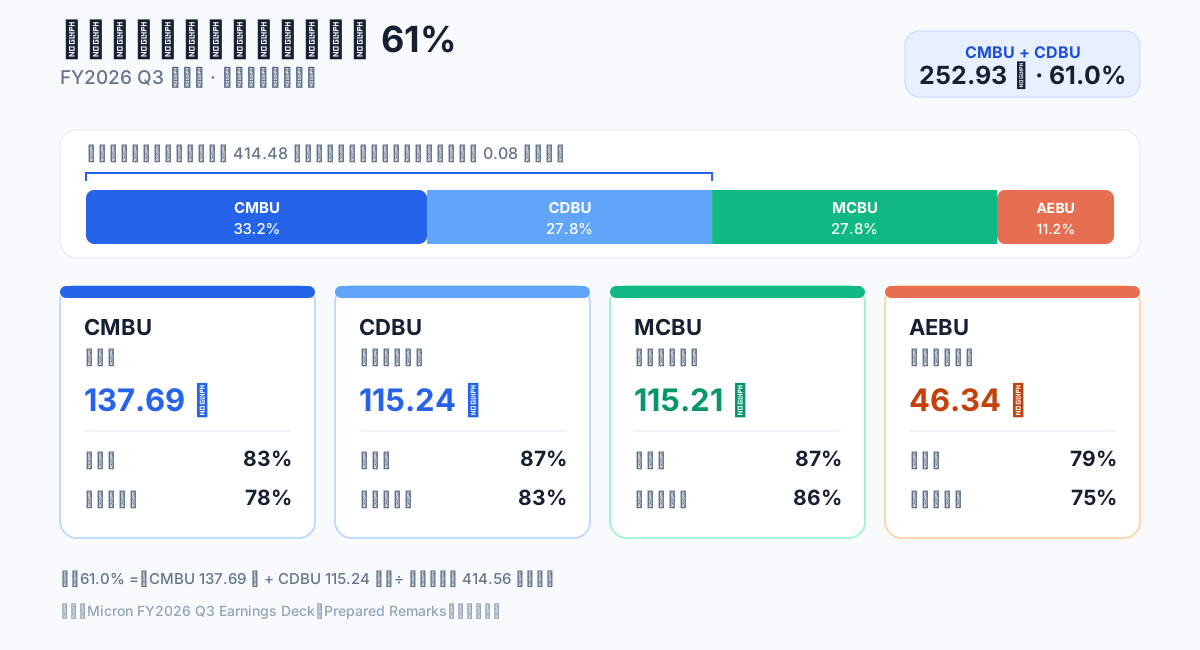
The fastest-growing segment was the Core Data Center Business Unit, whose revenue more than doubled quarter over quarter. Other segments also benefited from higher pricing: even with lower bit shipments in Mobile and Client, revenue rose 49% quarter over quarter and gross margin reached 87%.
This shows that the impact of AI on the memory industry is no longer just “selling more HBM”.
HBM itself requires larger wafer area and more complex manufacturing and packaging processes. The stronger the demand for HBM, the more obvious the squeeze on ordinary DRAM production capacity will be; at the same time, AI servers have increased the demand for large-capacity DDR, low-power server DRAM and data center SSD.
Therefore, what Micron is currently facing is not a single product boom, but two simultaneous changes:
- AI directly increases demand for high-value memory products;
- High-value products consume more production capacity, which indirectly tightens the supply of other memory products.
Micron disclosed that the cumulative shipment revenue of HBM4 has exceeded US$1 billion, and the production ramp rate of HBM4 12-high in the same stage is about twice that of HBM3E 12-high. But the competitive background cannot be omitted: SK Hynix has also started mass production and shipment of HBM4 and positioned itself as the HBM leader; Samsung is expanding HBM4 sales. Therefore, Micron’s twice the ramp rate indicates that the pace of catching up and execution is accelerating, but the ramp rate of a single product does not mean that the market share has overtaken.
Judging from the financial results, what really drives Micron’s company-wide profit margins is not HBM as a product, but the tight supply and demand that spreads to the entire DRAM and NAND product portfolio.
4. SCA Is the Most Important Part of This Earnings Report
As of the earnings report conference call on June 24, 2026, Micron has signed 16 strategic customer agreements (SCA), including agreements signed after the end of FY2026 Q3. Key features include:
- Most agreements run until the end of 2030, with automotive customer agreements typically lasting three years;
- Adopt a “take-or-pay” structure;
- Signed agreements cover approximately 20% of DRAM shipments and one-third of NAND shipments;
- 14 of these agreements have a residual performance obligation (RPO) of approximately $100 billion based on minimum committed volumes and minimum prices;
- Signed agreements are expected to result in $22 billion in cash deposits and related financial commitments, of which approximately $18 billion is cash deposits;
- Micron expects approximately half or more of revenue to come from SCA upon completion of all planned agreements.
Why These Agreements Matter
The traditional memory industry can be highly profitable, but those profits are difficult to predict: demand exceeds supply, prices rise, producers expand capacity, and the resulting new supply can later create a glut, lower prices, and force production cuts. Investors therefore start worrying about the cycle peak precisely when profits look strongest.
SCA attempts to change three variables simultaneously:
- Lower quantity limit: The customer commits to purchase a specific quantity;
- Price Lower Limit: Even if industry prices fall, Micron still has minimum price protection;
- Financial Support: Customers help Micron increase capacity expansion certainty through deposits and related financial commitments.
Management stated that even if the agreement with a price range is executed according to the lower price limit, it can still bring gross margin that is significantly higher than the quarterly peak of any past cycle. If it ultimately materializes, this means Micron’s profit bottom could be significantly higher than historical levels during the next round of industry price pullbacks.
But be aware of one disclosure difference
As of May 28, 2026, remaining performance obligations disclosed in the 10-Q were approximately $5 billionand contract liabilities were only $422 million, significantly lower than the $100 billion in minimum contract revenue and $22 billion in financial commitments mentioned in the release.
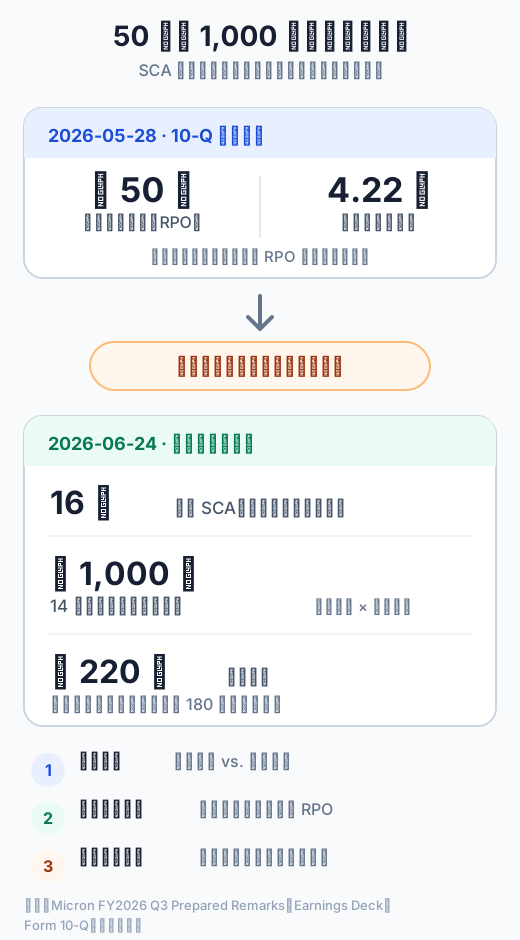
This is not necessarily a contradiction. The main reasons are:
- Some agreements were signed after the end of the quarter;
- Agreements without fixed prices or price ranges are not included in the remaining performance obligations;
- Performance obligations on the 10-Q are calculated only based on minimum quantity and minimum price;
- $22 billion includes future cash deposits and other financial commitments that do not equal contractual liabilities that have been received at the end of the period.
There are two further limitations that are easily obscured by the headline numbers.
First, $100 billion is not new orders, nor does it equal $100 billion in incremental revenue. If mechanically allocated evenly over about 4.5 years from mid-2026 to the end of 2030, the annual average would be about $22.2 billion, but this is only an arithmetic allocation and does not represent the actual revenue recognition pace, nor is it management guidance. Management’s statement that “approximately half or more of future revenue will come from SCA” is the coverage basis, while the $100 billion is the RPO basis of 14 agreements calculated based on the lowest quantity and lowest price. The two cannot be added together, nor can they be mutually verified.
Second, about $18 billion in cash deposits are also not profits. The management made it clear that these deposits will be included in the cash flow from financing activities and will not enter free cash flow, and will be gradually returned to customers in the second half of the agreement. The arrival of the deposit will increase the cash on the books, but in economic essence it is closer to customer financing or contract-related liabilities and cannot be directly regarded as permanent net cash.
What is most worth checking in the following quarters is not just how many more agreements Micron has signed, but:
- How much cash deposit was actually received;
- How much the contract liabilities and remaining performance obligations will increase;
- Whether the proportion of SCA revenue increases as expected by management;
- Can price floors truly protect profit margins when the industry fluctuates.
Signing the contract is only the first step, and the fulfillment in the financial statements is the evidence.
5. Cash Flow Is Strong, but Not All Cash Should Be Treated as Recurring Earnings
Micron generated $25.388 billion of operating cash flow in the quarter, equal to about 90% of net income. Operating cash flow for the first nine months was $45.702 billion, or about 97% of net income over the same period.
After investing $7.084 billion in net capital expenditures, the company still generated $18.304 billion in adjusted capital expenditures, with a profit margin of 44.2%. This shows that profits did translate into a lot of cash, but the nine-month cash conversion rate of 97% still needs to be unpacked.
In the first nine months, accounts payable and accruals, other current liabilities and other non-current liabilities combined contributed approximately $10.671 billion to operating cash flow. Two of them are particularly noteworthy:
- After the implementation of Pillar Two, income taxes payable in other non-current liabilities increased by approximately $5.142 billion from $648 million to $5.790 billion; these taxes will still need to be paid in the future;
- Estimated customer consideration payable related to price adjustments and returns rose $2.130 billion to $3.320 billion from $1.190 billion; it represents a potential future obligation that can be reduced against revenue.
Therefore, current cash flow cannot simply be annualized over the long term at current quarter levels. However, the growth of receivables cannot be directly equated to the deterioration of payment collection:
| Item | May 28, 2026 | August 28, 2025 |
|---|---|---|
| Trade receivables | USD 26.894 billion | USD 7.163 billion |
| Government incentive receivables | $3.408 billion | $1.572 billion |
| Total receivables | USD 31.025 billion | USD 9.265 billion |
The total receivables in balance sheet increased by US$21.760 billion, while the operating cash occupation listed in the cash flow statement was US$19.953 billion, a difference of US$1.807 billion. Government incentive receivables increased by $1.836 billion during the same period, and government incentive receipts were included in investing activities in the cash flow statement; this indicates that the difference is mainly related to government incentive receivables and cannot be confused with operating cash usage of trade receivables. However, the 10-Q does not provide an itemized bridge, so every point difference cannot be precisely attributed to the item.
In order to determine whether collections have deteriorated, it is not enough to look at the balance receivable alone. Divide the trade receivables at the end of each quarter by the current quarter’s revenue and then multiply by 91 days to perform a rough calculation of the same basis:
| Quarter | Ending trade receivables ($100 million) | Quarterly revenue ($100 million) | Estimated days sales outstanding |
|---|---|---|---|
| FY2025 Q3 | 54.92 | 93.01 | 54 days |
| FY2026 Q2 | 153.89 | 238.60 | 59 days |
| FY2026 Q3 | 268.94 | 414.56 | 59 days |
A more rigorous conclusion is that the number of days receivable is basically stable month-on-month, but lengthened by about 5 days year-on-year. Considering the rapid changes in revenue scale and customer structure, there is currently no evidence that Q3 collections have deteriorated significantly from the previous quarter, but the single point of 59 days cannot be interpreted as the quality of collections has been proven. Operating cash flow is dragged down by the growth of trade receivables, and benefits from the timing of payment of taxes, customer consideration and other liabilities. When judging quality, it is necessary to look at both ends at the same time.
As data center’s revenue share increases, customer concentration becomes higher, and multi-year agreements are added, customer credit and repayment quality will become more important. It will be necessary to observe whether the number of days receivable continues to rise and whether the cash deposit can reduce the risk of repayment.
6. Inventory Did Not Surge with Revenue, Reinforcing the Tight-Supply Thesis
Micron ended the quarter with $8.567 billion in inventory, up just 2.5% from the end of fiscal 2025. in:
| Inventory items | 2026-05-28 | 2025-08-28 |
|---|---|---|
| Finished Goods | $621 million | $1.094 billion |
| Work in progress | USD 6.960 billion | USD 6.401 billion |
| Raw materials and supplies | $986 million | $860 million |
While revenue grew significantly, finished goods inventories fell by 43%. Management disclosed total inventory days of 120 days, with DRAM inventory days below that level.
These figures are consistent with tight supply: products are not piling up unsold, work in progress represents most inventory, and finished-goods inventory remains relatively scarce.
However, 120 days cannot be directly understood as “high inventory”. According to this article’s understanding of the indicator, the denominator of inventory days is the cost of sales, and the cost of sales this quarter is only equivalent to about 15.4% of revenue; extremely high gross margin will mathematically increase the inventory days. Compared with the single number of days indicator, the absolute amount of inventory has almost remained unchanged and the finished goods have dropped by 43%, which is a better indication that the current situation is indeed tight.
We still need to observe the work-in-progress in the future. If revenue slows and work-in-progress continues to accumulate, inventory structure could still be a leading indicator of a cycle reversal.
7. The Balance Sheet Now Holds Substantial Net Cash
At the end of the quarter, Micron had:
- Cash and cash equivalents: US$24.995 billion
- Short-term investments: USD 1.027 billion
- Long-term valuable investments: USD 4.106 billion
- Restricted cash: USD 27 million
- Total cash, investments and restricted cash: US$30.155 billion
- Total debt: $5.722 billion
- net cash (including restricted cash): $24.433 billion
Excluding restricted cash, net cash is US$24.406 billion. This article adopts the method of including restricted cash and clearly lists it here to avoid inconsistency between asset items and the calculation of net cash.
Debt fell from $14.577 billion to $5.722 billion in the first nine months of fiscal 2026, a decrease of about 61%. During the same period, the company prepaid debt principal of approximately US$8.511 billion, for which it recognized a loss of approximately US$500 million in prepayment of debt.
This approach sacrifices part of the current profits, but significantly reduces future interest burdens and financial risks. The company’s current weighted average maturity of outstanding debt is April 2035, and there is little short-term debt repayment pressure.
Micron plans to invest approximately $27 billion in net capital expenditures in fiscal 2026, and will still need to build U.S. fabs, Taiwanese production capacity and Singapore advanced packaging facilities in the coming years. The value of a strong balance sheet is that even if capacity expansion expenses remain high, the company does not have to rely on high leverage to complete investments.
But capacity expansion pressure has not yet fully entered the income statement. By the end of the quarter, construction in progress had risen from $5.518 billion to $10.935 billion, and the company separately disclosed $4.20 billion in costs related to equipment not yet in use. The two disclosures may have overlapping standards and cannot be directly added; they both point to the fact that a large number of assets have not yet formed corresponding output, and after being put into use, production capacity and depreciation will be increased at the same time.
Management expects FY2027 capital expenditures to be higher each quarter than the roughly $10 billion in FY2026 Q4, and more than half of the year-over-year increase will be spent on plant construction. From this point of view, the main risk for capacity expansion is not only how much cash is spent today, but also whether the increase in depreciation will coincide with the improvement of industry supply after the centralized implementation of new production capacity in FY2027-FY2028.
In terms of shareholder returns, the company repurchased no shares during the quarter under its public repurchase authorization, after repurchasing $650 million under that authorization in the first nine months. An additional $762 million is included in the cash flow statement for share withholding related to employee equity awards, which were not management-initiated open market repurchases. Management plans to increase capital returns starting after December 9, 2026 and proposes to return 100% of excess cash to shareholders over the long term. As of the date of this article, September 3, 2026, that date has not yet arrived; and the “excess cash” is still dependent on capital expenditures, debt management and customer-deposit repayments, so it should be considered a capital allocation plan at this time rather than a repurchase commitment that has been fulfilled.
8. Q4 Guidance Moved Higher, but Gross-Margin Expansion Is Slowing
The FY2026 Q4 Non-GAAP guidance given by Micron is:
| Metrics | Q4 Midpoint Guidance | Versus Q3 Non-GAAP Actual |
|---|---|---|
| Revenue | $50.0 billion | +20.6% |
| Gross margin | About 86% | +1.1pct |
| Operating expenses | Approximately $1.65 billion | +8.7% |
| EPS | $31.00 | +23.5% |
The guidance remains very strong: median revenue growth of 20.6% sequentially and median EPS growth of 23.5% sequentially suggest that absolute profits continue to expand. But what really deserves attention is not just the $50 billion in revenue, but the growth structure that has begun to change.
First, management made it clear that approximately 86% of gross margin guidance already reflects a significant slowdown in price increases. According to the same Non-GAAP basis, Q3 gross margin increased by approximately 10.0 percentage points month-on-month, and Q4 guidance only increased by approximately 1.1 percentage points. This does not mean that the price is about to fall, but it means that the previous jump of gross margin, driven by a sharp price increase, is gradually approaching the high platform.
Second, operating expense guidance is only up about 8.7% sequentially, significantly slower than revenue and EPS. Based on the guidance median projection, Q4 Non-GAAP gross profit will be approximately US$43 billion, operating profit will be approximately US$41.35 billion, and operating margin will be approximately 82.7%. These absolute amounts and profit margins are calculated by the author based on company guidance and are not guidance items given by the company alone.
Therefore, the core signal of Q4 can be summarized as: Earnings are still reaching new highs, but the pace of incremental improvement is slowing. To judge whether profits can continue to grow in the future, the focus will rise rapidly from gross margin and gradually shift to revenue contribution from shipments, product structure, long-term contract execution and new production capacity.
9. Six Key Risks
1. Pricing Remains the Biggest Variable
The static stress test in Section 2 quantifies the sensitivity of current profits to price, but the real price reduction cycle will also superimpose operating rate, cost, impairment and depreciation pressures, and the actual profit decline will usually not be as smooth as the fixed cost model.
2. SCA Reduces Downside Volatility but May Also Limit Upside Participation
The price caps for some large-value agreements usually refer to the market price in the second quarter (CQ2) of the calendar year 2026. If spot prices continue to rise significantly in the future, the portion covered by SCA may not be able to fully enjoy the upside.
This is an arrangement that trades some upside for long-term stability.
3. Customer Deposits Must Eventually Be Repaid
The approximately $18 billion cash deposit will initially increase financing cash flow and cash on paper, but management said it will be gradually returned over the second half of the agreement’s term. If the return progress overlaps with high capital expenditures, rising depreciation or industry downturn, the free cash flow and net cash buffers at that time may be weakened; the specific year still depends on each agreement and arrangement, and it cannot be directly concluded that all will be concentrated in FY2028-FY2030.
4. Customer and Data-Center Concentration Remain High, but Are Not Rising in a Straight Line
In the first nine months of fiscal 2026, the largest single customer contributed 10% of revenue, down from 16% in the same period a year earlier, indicating that current single customer concentration has actually improved.
However, the top ten customers will still contribute more than half of the revenue in 2025, and data center-related revenue reached approximately 61% this quarter. While long-term contracts strengthen customer relationships, they may also concentrate future sales and deposits on a few large customers, so it is still necessary to pay attention to counterparty credit, contract renegotiations, and changes in customer capital expenditures.
5. Capacity Expansion Is Large and Slow to Come Online
Idaho ID1 plans to produce the first batch of wafers in mid-2027, and ID2 plans to produce the first batch of wafers at the end of 2028; Taiwan’s Tongluo plant is expected to form substantial shipments in mid-2027, and Singapore’s HBM packaging capacity is expected to start contributing in the first half of 2027.
These projects require significant amounts of capital, equipment, energy and technical personnel, and any delays could impact supply and return on investment.
6. Geopolitical and Competitive Risks Have Not Disappeared
Most of Micron’s DRAM production in fiscal 2025 will come from Taiwan, and it faces risks from Chinese market restrictions, export controls, critical material supply, and competitors capacity expansion such as Samsung, SK Hynix, and Changxin Memory.
The longer supply shortages persist, the greater the incentive for competitors to increase capital investment. Long-term contracts can buffer the cycle, but they cannot prevent industry supply from eventually increasing.
10. What Really Matters from Here
For the next earnings report, I will not just look at whether revenue and EPS continue to reach new highs, but will focus on checking five sets of indicators:
- Pricing and volume: DRAM and NAND ASPs, plus bit shipments into price-sensitive markets;
- SCA conversion: RPO, contract liabilities, cash-deposit receipts, and repayment terms;
- Working capital: days receivable, estimated consideration payable to customers, and inventory of work in progress and finished goods;
- Profitability and cost: the pace of gross-margin expansion, unit costs, and depreciation as new capacity comes online;
- Supply progress: ID1, Tongluo, the Singapore HBM packaging project, and capacity expansion by peers such as Samsung and SK Hynix.
The most important variables remain pricing, SCA conversion into reported results, and the depreciation and supply created by new capacity.
Final Thoughts
Micron’s FY2026 Q3 profit surge began with the pricing benefit of an extreme supply-demand imbalance. Management, however, did not treat it as merely a short-term windfall. While customers were concerned about shortages, Micron used SCAs to link supply guarantees and pricing bands to customer deposits.
If these agreements are executed successfully, Micron will remain cyclical, but earnings may become less dependent on spot prices and more influenced by a mix of spot pricing and long-term contracts.
The most important takeaway is not the 84.6% GAAP gross margin, but Micron’s attempt to reshape the distribution of future profits through SCA: raise the cycle floor while accepting an earlier cap on the pricing of some products. This does not eliminate cyclicality; it exchanges part of the upside for long-term orders, price protection, and customer financing.
Contracts support the thesis, but future RPO, contract liabilities, cash deposits, and realized gross margins still need to confirm it. At the same time, FY2027–FY2028 capital spending and depreciation could push the earnings floor lower again.
In the short term, Micron is benefiting from rising memory prices. In the long term, valuation will depend on whether the higher earnings floor created by SCAs can absorb depreciation from new capacity and the next round of supply expansion.
Basis of presentation: Unless otherwise noted, historical financial data in this article is presented on a GAAP basis, while FY2026 Q4 guidance uses the company’s non-GAAP basis. Clearly labeled ratios, growth rates, receivable-day estimates, and scenario analyses are the author’s calculations from disclosed figures, not additional company guidance.
Data and sources
The principal sources used in this review are:
- Micron FY2026 Q3 Financial Results Press Release
- Micron FY2026 Q3 earnings call and materials page
- Micron FY2026 Q3 Prepared Remarks
- Micron FY2026 Q3 Earnings Deck
- SEC Form 10-Q: Quarter ended May 28, 2026
- SEC Form 10-Q: Quarter ended February 26, 2026
- SEC Form 10-Q: Quarter ended May 29, 2025
- SK hynix 2026 second quarter results announcement
- Samsung Electronics 2026 Second Quarter Results Announcement
This is a personal research record, not investment advice.